In our current data-centric world, companies and analysts depend on business intelligence (BI) tools to extract meaningful insights and take informed actions. Microsoft Power BI is one of the most widely used and sleek BI tools available that allows users to visualize, analyze and share data easily. New to Power BI or an old pro, Power BI examples can help you understand what is possible and inspire your next dashboard!
Why Dashboards Matter in Power BI
Dashboards are the visual component of your data analysis. They let you monitor essential metrics, observe what’s trending and monitor performance — all in one location. Power BI dashboards comprise different imagery, visuals, and reports that provide a single view for you to make important decisions about your business.
One of the key reasons why Power BI is so powerful is that it’s flexible. You can create industry- or department-specific dashboards — from finance to marketing, and from sales to operations. But before you build your own, it’s a good idea to check out some Power BI dashboard examples to see both what’s possible and how others in your industry are using Power BI to get inspired.
Power BI Dashboard Examples for Beginners
If you are new to Power BI, beginning with straightforward dashboards that people can easily read is probably a good idea. These examples typically involve basic visualizations, simple KPIs and minimal interactions.
1. Sales Performance Dashboard
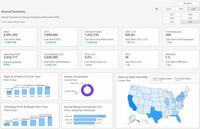
To some degree, yes, this is a prototypical beginner-friendly dashboard. It typically includes:
· Total sales
· Sales by region
· Top-selling products
· Monthly sales trends
This type of dashboard is designed to help you learn to use tools such as bar charts, pie charts, and line graphs, along with slicers to filter your data by region, period, or product category.
2. Customer Feedback Dashboard
A feedback dashboard would work fine for service-based industries. Beginners can use it to:
· Display customer satisfaction scores
· Track feedback trends over time
· Show Sentiment representation with word clouds or bar charts
It is a cool way to learn text analytics and a few basic DAX formulas.
3. Employee Attendance Tracker
This simple dashboard can be used by HR professionals or those who are new to Power BI to:
· Monitor daily attendance
· Track leaves and absences
· Identify patterns in employee behavior
It lays the foundation of date-time data and format.
Power BI Dashboard Examples for Experts
More advanced users can also tap into Power BI’s advanced capabilities, including real-time analytics, predictive modelling, and cross-functional data integration. These dashboards demonstrate how master users utilize Power BI to deliver business intelligence.
1. Financial Management Dashboard
A complete financial dashboard can have:
· Profit and loss statements
· Cash flow analysis
· Budget vs. actual comparisons
· Forecasting and trend analysis
Experts regularly use DAX calculations and custom visuals to give a clear financial picture. This dashboard supports the decision-making process for fiscal health.
2. Marketing Campaign Dashboard
This dashboard is great for monitoring the ROI of marketing campaigns. More advanced users may need to pull data in from sources such as Google Ads, social platforms, and/or email marketing tools to:
· Measure cost per lead (CPL)
· Track campaign performance by channel
· Analyze customer acquisition trends
Rich visuals enable users to go deeper into campaign-level metrics.
3. Operational Efficiency Dashboard
This dashboard monitors organizations that are working on manufacturing and logistics:
· Production output
· Machine downtime
· Delivery times and logistics costs
Real-time data feeds and custom KPIs enable our teams to drive performance in real-time with this dashboard.
Choosing the Right Dashboard for Your Needs
If you are scrolling through Power BI dashboard examples for beginners or inspiration on creating an executive dashboard for top-level officers, find a way to match your visual elements and visuals with your business goals. Begin with something simple, then scale it later after you’re comfortable with the tool.
Final Thoughts
Power BI provides a comprehensive suite of features to support data visualization and analysis by exploring Power BI dashboard examples, both beginners and experts can learn how to design dashboards that people will be proud to share—and more importantly—act on.
When managing customers, the success of your business can sometimes depend on the effectiveness of your dashboards. So, start exploring Power BI, look at some of these, and create those dashboards that tell interesting stories with data.